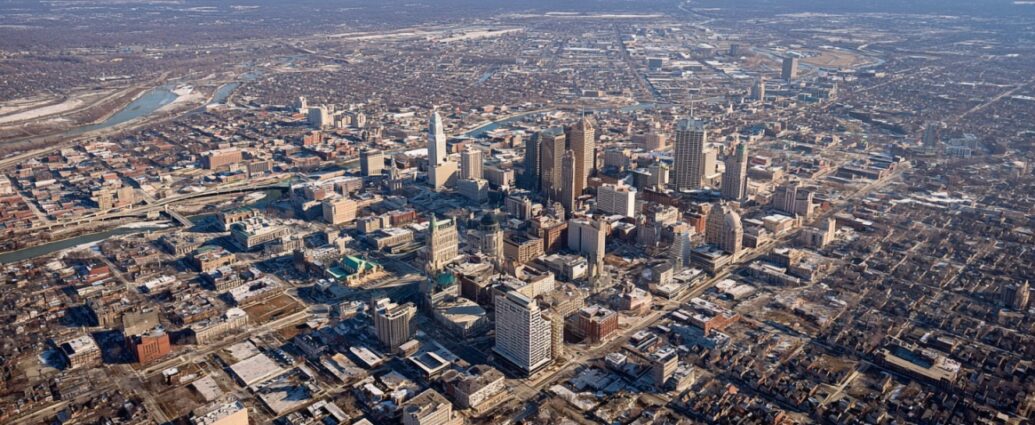
Indianapolis ranks as the largest city in Indiana and functions as the central hub of the Indianapolis metropolitan area. Metropolitan Indianapolis stretches across multiple counties in central Indiana and forms one of the largest economic and population centers in the state.
Recent census estimates show a noticeable pattern in regional population change.
At the same time, suburban counties surrounding Indianapolis have experienced stronger population increases.
Post-pandemic migration patterns across the United States help explain this shift. Many households have relocated away from dense urban neighborhoods and toward suburban communities offering newer housing, larger living spaces, and lower population density.
Indianapolis provides a clear example of a modern urban pattern in the United States.
Let’s talk about it.
Current Population Levels in Indianapolis
The municipal core of the region, measured via the Indianapolis city balance by the U.S. Census Bureau, reached 901,116 residents in recent federal estimates, up from the 891,484 recorded in 2024 and 887,213 during the 2020 Census.
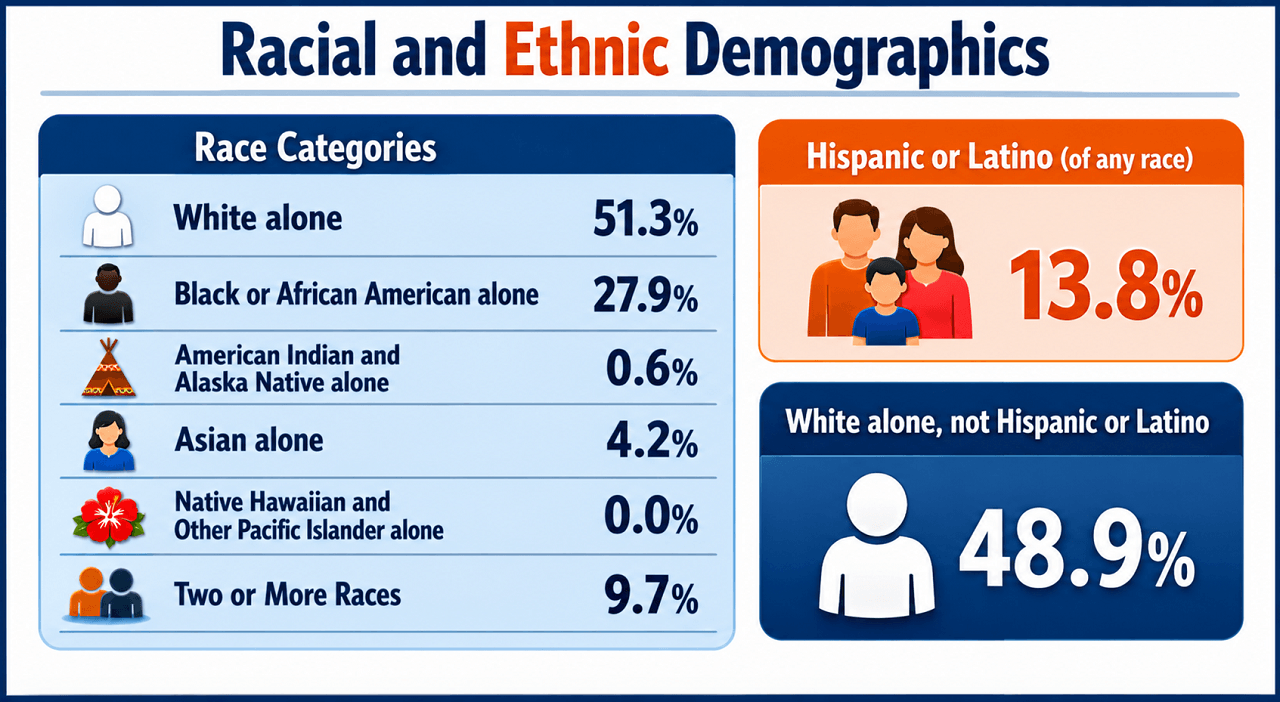
According to official municipal data, the racial and ethnic composition of Indianapolis city balance is distributed as follows:
| Race and Hispanic Origin Category | % |
|---|---|
| White alone | 51.3% |
| Black or African American alone | 27.9% |
| American Indian and Alaska Native alone | 0.6% |
| Asian alone | 4.2% |
| Native Hawaiian and Other Pacific Islander alone | 0.0% |
| Two or More Races | 9.7% |
| Hispanic or Latino (of any race) | 13.8% |
| White alone, not Hispanic or Latino | 48.9% |
The updated municipal data reveals a total growth of approximately 1.5% since the turn of the decade. The city surpassed the 900,000 threshold for the first time in its history. This milestone reflects an acceleration in urban residency compared to the stagnant figures seen early in the decade, though the pace remains modest relative to the surrounding metropolitan rings.
Marion County mirroring this trajectory, expanded to 992,196 residents according to the latest Indiana Business Research Center analysis, rising from 981,628 in 2024 and 977,203 at the 2020 Census. Demographers note that Marion County grew by 1,983 residents last year, representing a 0.2% annual increase. This figure marks the smallest annual expansion for the core county since 2021, falling significantly below the 9,886 residents added the prior year, highlighting a localized slowdown in the immediate urban core.
Indianapolis continues to hold political, administrative, and economic weight in central Indiana, yet recent numbers show that city and county totals have moved far more slowly than those in many nearby suburban areas. That contrast sets up the larger metro pattern visible across the region.
The Metropolitan Area
Metro Indianapolis functions as a regional system rather than a single-city story. Commuting patterns, housing demand, and business activity tie Indianapolis to neighboring counties so closely that population change in one area often shapes outcomes across the others.
The broader Indianapolis-Carmel-Anderson metropolitan statistical area (MSA) encompasses 2,205,695 residents, an increase from 2,143,859 in 2024 and 2,058,839 in 2020. This transformation represents a 5.6% regional growth rate since 2020, significantly outpacing both the core city and the state average of 2.8%.
Metro structure also matters. STATS Indiana lists the metro area as including Boone, Hamilton, Hancock, Hendricks, Johnson, Madison, Marion, Morgan, and Shelby counties. Population gains across these counties do not occur evenly, and recent estimates show that most momentum has occurred outside the central city.
Evidence of Metro Growth
Population trends across central Indiana show that metropolitan Indianapolis has expanded at a faster pace than the central city.
Regional growth since 2020 has occurred through a combination of suburban residential development, strong employment growth, and migration patterns that favor communities surrounding Indianapolis.
Metro data therefore show clear evidence that the broader Indianapolis region continues to add residents even as population growth inside city limits remains relatively slow.
Suburban Expansion
Suburban counties dominate regional population gains. While the urban core posts marginal increases, outer rings capture the vast majority of inbound domestic migration. Bureau figures detail this uneven expansion:
| County | Population 2020 | Population 2024 | Population 2025/2026 Ring Estimates | Total Multi-Year Growth Rate |
|---|---|---|---|---|
| Hamilton County | 347,467 | 379,704 | 387,055 | 11.4% |
| Hendricks County | 174,788 | 190,629 | 193,298 | 10.6% |
| Johnson County | 161,765 | 170,614 | 173,853 | 7.5% |
| Hancock County | 79,840 | 88,810 | 90,142 | 12.9% |
Hamilton County led the state in absolute growth, adding 7,351 residents in a single calendar year, followed closely by Johnson County with an increase of 3,239. On a percentage basis, outer-tier territories like Morgan County (1.2% annual growth) and Madison County (1.1% annual growth) emerged as new suburban frontiers, demonstrating that the metropolitan footprint is expanding further outward into peripheral agricultural boundaries.
Regional dynamics also outpace broader national averages. While the overall United States population growth rate hovered near 0.52%, the Indianapolis metropolitan area maintained an annualized expansion rate above 1.1%, reinforcing its status as the 33rd largest metro economy in the country. The Daily Journal reported that this regional momentum accounts for roughly 60% of Indiana’s total statewide population growth, cementing the area as the primary demographic engine of the state.
Growth in suburban municipalities adds more evidence.
- Brownsburg rose to 34,089 residents, securing a multi-year population increase of over 16.8% since 2020.
- Avon expanded to 24,735 residents, an increase of 14.2% across the same period.
- Zionsville gained significant inbound families, pushing past 33,000 regional residents.
- Whitestown posted an unprecedented 40.7% surge, solidifying its place among the fastest-growing small municipalities in the Midwest.
Economic Drivers of Growth
Job growth across central Indiana has helped support metro expansion, especially in suburban counties where housing construction has kept pace with demand.
Indianapolis remains the region’s largest economic center, but employment growth has spread outward into:
- logistics corridors
- suburban office nodes
- life sciences clusters
- industrial parks
Indiana Business Review reporting lists total regional private employment at 965,484 workers, with total nonfarm payrolls holding steady at an average weekly wage of $1,325. Labor market metrics reveal a highly resilient economy, with the metropolitan unemployment rate settling at a low 3.3%.
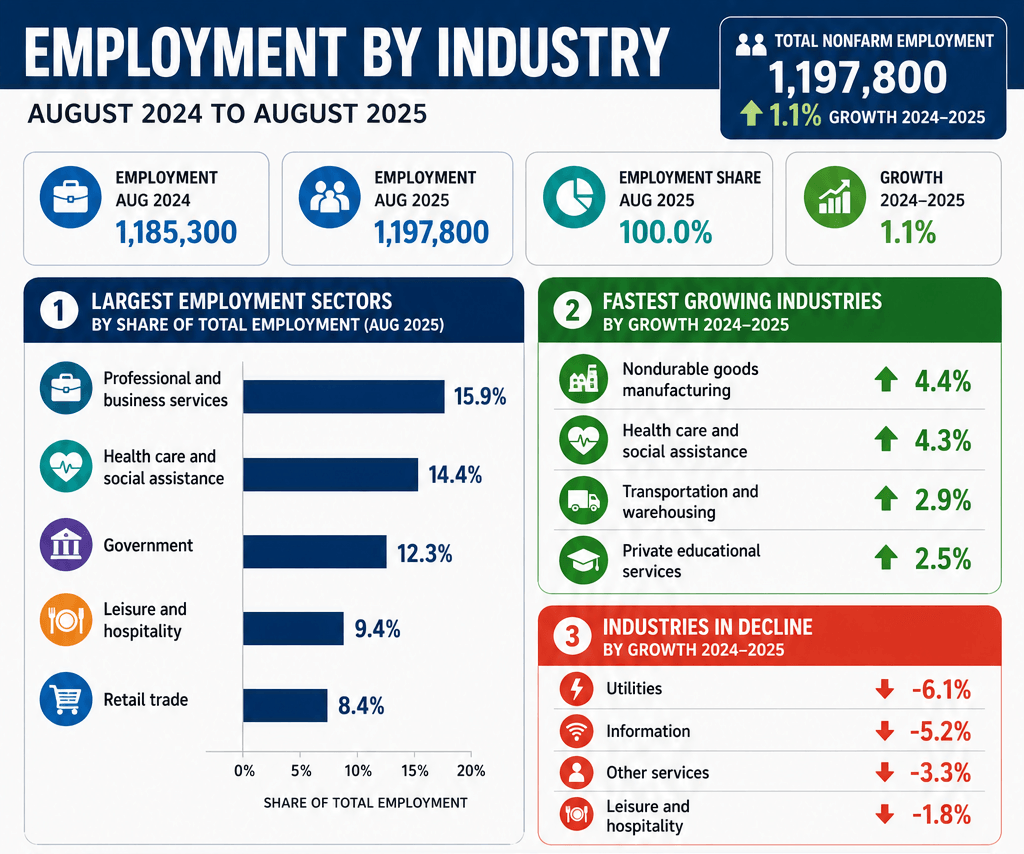
The structural composition of the labor force indicates where commercial investment is concentrating:
| Industry | Employment Aug 2024 | Employment Aug 2025 | Employment Share Aug 2025 | Growth 2024–2025 |
|---|---|---|---|---|
| Natural resources and mining | 700 | 700 | 0.1% | 0.0% |
| Construction | 69,100 | 70,000 | 5.8% | 1.3% |
| Durable goods manufacturing | 51,700 | 51,100 | 4.3% | -1.2% |
| Nondurable goods manufacturing | 45,300 | 47,300 | 3.9% | 4.4% |
| Wholesale trade | 55,900 | 56,600 | 4.7% | 1.3% |
| Retail trade | 99,700 | 100,100 | 8.4% | 0.4% |
| Transportation and warehousing | 87,100 | 89,600 | 7.5% | 2.9% |
| Utilities | 3,300 | 3,100 | 0.3% | -6.1% |
| Information | 11,600 | 11,000 | 0.9% | -5.2% |
| Financial activities | 75,300 | 75,000 | 6.3% | -0.4% |
| Professional and business services | 187,800 | 190,300 | 15.9% | 1.3% |
| Private educational services | 19,900 | 20,400 | 1.7% | 2.5% |
| Health care and social assistance | 165,300 | 172,400 | 14.4% | 4.3% |
| Leisure and hospitality | 115,200 | 113,100 | 9.4% | -1.8% |
| Other services | 50,900 | 49,200 | 4.1% | -3.3% |
| Government | 146,500 | 147,900 | 12.3% | 1.0% |
| Total nonfarm employment | 1,185,300 | 1,197,800 | 100.0% | 1.1% |
Source material for the region also identifies major employment concentrations in manufacturing, transportation and warehousing, professional and business services, and private education and health services. Indiana’s economic development material identifies life sciences as one of the state’s strongest industry groups, while Indy Chamber regional material lists life sciences, technology, and related corporate employers as central parts of the Indianapolis regional economy.
Immigration as a Growth Factor

International migration has become one of the most important contributors to recent metro growth. That pattern matches a national shift noted by the Census Bureau, which reported that international migration played a major role in metro population gains between 2023 and 2024.
Demographic research emphasizes that net international migration serves as the primary catalyst preventing broader population contraction across the state. The Indiana University report highlights that immigration was responsible for 81% of total population gains statewide over the last three years. A net inflow of 17,852 international residents registered in the most recent annualized tracking loop, offsetting a sharp 53% drop from the record immigration spikes seen previously.
Concurrently, domestic migration trends within the state shifted, with net domestic migration more than doubling to an annual influx of 12,197 people. These dual migration forces have cushioned the region against a softening natural population growth rate, ensuring that local corporations maintain a steady pipeline of human capital to support expanding logistical and technological complexes.
Signs of Urban Decline in the Core City
Core-city decline in Indianapolis has not taken the form of dramatic collapse, yet city estimates do show a weaker trajectory than the surrounding region.
The gap between limited city growth and much faster suburban growth is one of the strongest themes in current population data.
Urban core tracking indicates a volatile trajectory, dipping from 887,644 residents in 2020 down to 882,456 in 2021, before climbing upward to 891,484 in 2024 and finally pushing past the 901,116 milestone. While the total number has experienced a positive net correction due to international placement, domestic migration loops show a clear exit of long-term residents out of the center city balance toward peripheral boundaries.
Another way to see the divide is to compare city and metro rates over roughly the same period. According to Axios, the Indianapolis suburbs continue to absorb the vast majority of new single-family residential investments, leaving the city balance lagging behind the outward expansion rate of its peripheral counties.
Demographic pressures add another constraint. As Fox59 states, natural population growth dropped by 7% recently, yielding a narrow surplus of only 8,561 more births than deaths statewide. Senior demographers conclude that the post-pandemic rebound in natural population growth peaked, meaning future regional development relies entirely on sustained migration patterns rather than local birth rates.
The Role of Suburbs in Regional Growth
Suburbs now account for a large share of population growth in central Indiana. Regional change has become increasingly concentrated in counties north, west, and south of Marion County, where land for new housing remains more available, and many communities continue to expand quickly.
Most important county gains since 2020 have occurred in places such as Hamilton, Hendricks, Hancock, and Johnson counties. Boone County has also benefited from fast-growing towns such as Whitestown and Zionsville. Those areas have added residents through both countywide growth and strong municipal expansion.
Specific municipal tallies document this rapid suburbanization trend:
- Whitestown: Expanded from 10,350 residents in 2020 to over 14,500 residents.
- Brownsburg: Increased from 29,169 residents in 2020 to an estimated municipal footprint of 34,089 residents.
- Avon: Moved upward from 21,655 residents to 24,735 residents.
- Bargersville: Surpassed 11,283 residents, continuing its rapid conversion of agricultural zones into master-planned neighborhoods.
Housing supply plays an important role in that movement. Many suburban communities have had more room for subdivision construction, larger-lot housing, and newer residential inventory than the central city. Local job nodes outside downtown Indianapolis have also expanded, especially in logistics and warehouse corridors, which makes suburban residence more practical for a larger share of workers.
Summary
Indianapolis demonstrates a metropolitan population pattern that appears in many parts of the United States. Suburban counties experience rapid population growth while central cities grow slowly or lose residents.
Population estimates and demographic data show continued expansion across the Indianapolis metropolitan area. City population growth remains limited compared with the growth occurring in surrounding counties.
Regional demographic change indicates that suburban expansion will remain a major factor shaping the future development of metropolitan Indianapolis.
Sources
- Census.gov – Indianapolis city (balance), Indiana
- StatsAmerica – Overview for Marion County, IN
- StatsIndiana – Indianapolis, IN Metro Area
- Daily Journal – IU analysis: Johnson County among Top 10 in state for population growth
- Indiana Business Review – Indianapolis forecast
- Indiana University – Indiana population estimates: Strong growth continued
- Axios – Indianapolis suburbs drive metro area growth
- Fox59 – Indiana’s large population growth is fueled by migration
- Business Insider – Every US state’s fastest-growing small town you’ve never heard of
- WishTV – Petition seeks to change Brownsburg from a town to a city