South Bend has always been a hard city to sum up in one sentence. Spend a day near downtown, by the river, or around Notre Dame, and the place can feel steady, familiar, and full of energy. Talk to families in neighborhoods where gunfire has shaped daily life, and the same city feels heavier.
That is why I do not like the lazy version of the South Bend crime story. The city is not a crime headline with a zip code attached. It is also not a comeback story that can ignore the people still living close to violence.
The newest official city number available during this May 2026 update comes from the South Bend Part I Crimes dashboard, which was updated through April 30, 2026 and showed 1,024 Part I crimes under the current dashboard filter. The city also warns that Part I crime data can change month to month as investigations develop.
That one number does not settle the argument. It gives the freshest city snapshot. For longer comparison, the NeighborhoodScout crime profile still places South Bend well above Indiana averages, using 2024 FBI-released data that came out in October 2025. For the lived story of 2026, the first quarter is where the tension sits: shootings rose from the unusually low start of 2025, while the broader trend still looks better than the pandemic years.
South Bend Is Safer than The Pandemic Peak, but The Risk Has Not Gone Away
The fair answer is the least dramatic one: South Bend is getting safer compared with the worst years of the early 2020s, but it still carries a higher crime profile than most Indiana communities.
That is the part many quick crime rankings miss. South Bend saw major violence during the pandemic period. Since then, gun violence has fallen by a wide margin. At the same time, residents are still dealing with shootings, assaults, thefts, vehicle crime, and neighborhood-by-neighborhood differences that do not show up cleanly in one citywide rate.
In other words, the trend is better. The experience on the ground can still feel uneven.
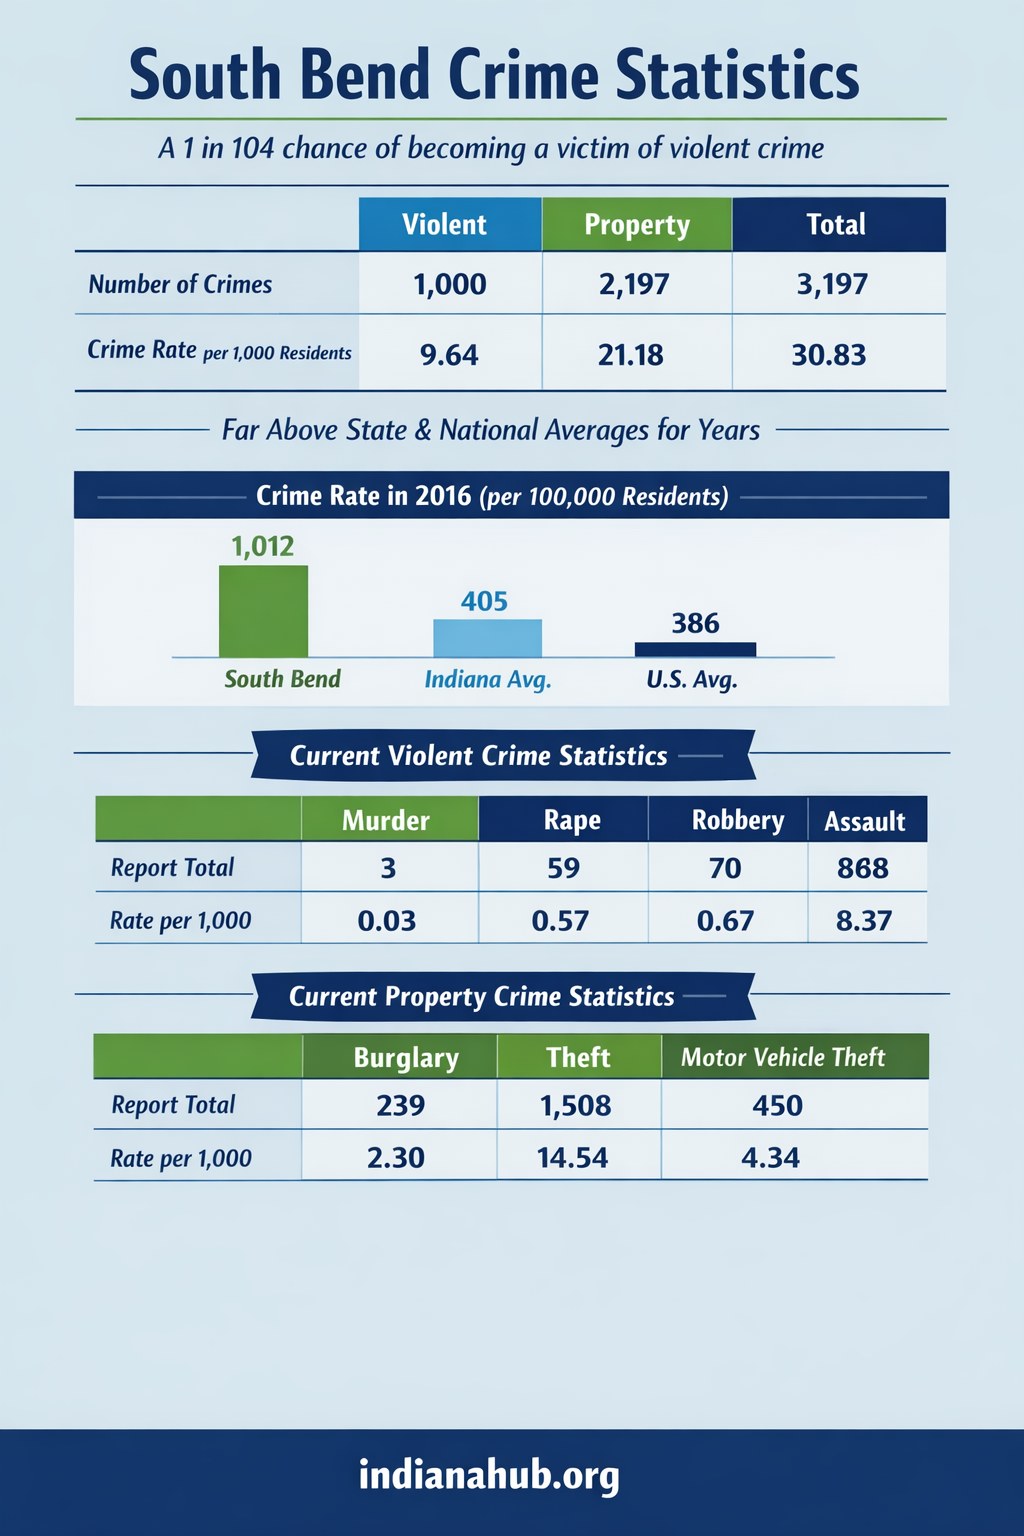
NeighborhoodScout lists South Bend at 30.83 total crimes per 1,000 residents. The same profile lists 9.64 violent crimes per 1,000 residents and 21.18 property crimes per 1,000 residents. Those figures are based on the legal city boundary and the latest annual FBI data available to that crime profile.
| Crime Category | Reported Crimes | Rate Per 1,000 Residents |
|---|---|---|
| Violent crime | 1,000 | 9.64 |
| Property crime | 2,197 | 21.18 |
| Total crime | 3,197 | 30.83 |
For Indiana, the same profile lists a violent crime rate of 3.13 per 1,000 residents and a property crime rate of 13.79. That gap is why South Bend still shows up in conversations about dangerous cities, even as local numbers have improved.
The First Quarter of 2026 Brought Back Anxiety
The first three months of 2026 were not the kind of start city leaders wanted. In its Q1 2026 public safety update, South Bend pointed residents to the April 16 crime-stat materials and video. Local reporting from WSBT laid out the main figure clearly: criminally assaulted shooting victims rose from five in the first quarter of 2025 to 10 in the first quarter of 2026.
Four of those 10 victims died. That is a painful number for a city of just over 103,000 people.
The context keeps the picture from turning into panic. South Bend had 22 criminally assaulted shooting victims in the first quarter of 2021, 20 in 2022, 17 in 2023, 12 in 2024, five in 2025, and 10 in 2026. So yes, 2026 started worse than 2025. It was still below the five-year first-quarter average of 15 victims.
| Year | Q1 Criminally Assaulted Shooting Victims |
|---|---|
| 2021 | 22 |
| 2022 | 20 |
| 2023 | 17 |
| 2024 | 12 |
| 2025 | 5 |
| 2026 | 10 |
That is the uncomfortable balance in the 2026 story. A resident can be right to worry about the rise from last year. City officials can also be right that the number is still below the recent five-year first-quarter average. Both points belong in the same article.
January Made the Improvement Feel Fragile
South Bend entered 2026 with bad news almost immediately. WNDU reported that violent crime rose in January after a five-year improvement trend. The report said police had eight shootings by the end of January, five of them group-member involved, and three fatal shootings early in the year.
That kind of start changes the public mood fast. Crime data may move in quarters and years. Families experience it by the week. A shooting near home, a school message, a block taped off by police, or a teenager killed before the month is over can make five-year improvement feel distant.
ABC57 also reported a violent start to the year, with five shootings confirmed before mid-January and two of them deadly. The report included comments from Mayor James Mueller and South Bend Police Chief Scott Ruszkowski about the strain on detectives and the concern that early violence could turn into retaliation.
For South Bend, the question is not whether one bad month wipes out years of progress. It does not. The question is whether the city can keep one bad month from becoming the next pattern.
The Longer Gun Violence Trend Still Points Downward
The strongest argument that South Bend has become safer comes from the drop in shootings since the pandemic peak. ABC57 reported that South Bend had 62 total criminally assaulted shootings in 2024, down from 124 in 2022 and 133 in 2020.
Fatal shootings also fell. South Bend had five fatal shootings in 2024, compared with 19 in 2023, 26 in 2022, 17 in 2021, and 23 in 2020.
- 133 criminally assaulted shootings in 2020
- 124 criminally assaulted shootings in 2022
- 62 criminally assaulted shootings in 2024
- 26 fatal shootings in 2022
- 5 fatal shootings in 2024
The 2025 numbers also moved in the right direction. WSBT reported in January 2026 that South Bend Police counted 574 gun violence incidents in 2025, down a little more than 11% from 2024. Murder victims stayed at seven in both 2024 and 2025.
That is why I would not call South Bend more dangerous in a broad sense. The city has moved down from the worst stretch. The first quarter of 2026 makes the improvement look less secure, not erased.
Property Crime Still Shapes Daily Life
Violence gets the headlines, and rightly so. Property crime is the part many residents deal with in quieter, more regular ways: stolen cars, theft from vehicles, burglary reports, and the feeling that a normal errand or overnight parking choice needs extra caution.
The NeighborhoodScout data puts South Bend at 21.18 property crimes per 1,000 residents. Theft makes up the largest share, followed by motor vehicle theft and burglary.
| Property Crime Category | Reported Crimes | Rate Per 1,000 Residents |
|---|---|---|
| Burglary | 239 | 2.30 |
| Theft | 1,508 | 14.54 |
| Motor vehicle theft | 450 | 4.34 |
Vehicle theft deserves its own mention because it remains one of the categories where South Bend stands out. NeighborhoodScout places the chance of car theft in South Bend at 1 in 230. Statewide, vehicle theft has also drawn attention. Visual Capitalist, using 2024 auto-theft data, listed the Hyundai Elantra as the most stolen vehicle model in Indiana, with 475 thefts.
That statewide figure should not be read as a South Bend-only count. It does show why vehicle crime remains part of the safety conversation in Indiana cities.
Why South Bend Still Feels Unsafe in Some Neighborhoods
Crime in South Bend is not spread evenly from block to block. A visitor staying near Notre Dame, a student walking near campus, a family on the far south side, and a longtime resident near a street with repeat calls may all describe different versions of the same city.
The economic backdrop helps explain part of that divide. The U.S. Census Bureau QuickFacts profile lists South Bend at 103,201 residents as of July 1, 2025. The same profile lists a 20.8% poverty rate and a median household income of $55,786 for 2020-2024.
| South Bend Measure | Latest Figure |
|---|---|
| Population estimate, July 1, 2025 | 103,201 |
| Median household income, 2020-2024 | $55,786 |
| Per capita income, 2020-2024 | $30,791 |
| Persons in poverty, 2020-2024 | 20.8% |
Poverty does not explain every shooting, assault, or burglary. Still, high poverty, unstable housing, neighborhood disinvestment, and limited opportunity can create conditions where crime becomes harder to reduce and harder to keep down.
That is why South Bend can improve on paper while still feeling tense in the places that have carried the heaviest burden for years.
Police Are Leaning Harder on Cameras, Drones, and Faster Response
South Bend Police have also changed how they respond. The department now leans more heavily on the RTCC, license plate readers, connected cameras, and drones.
Local reporting from the April 2026 Q1 update said the department crime center uses Fusus software to connect to more than 500 cameras, including 45 Flock cameras and 89 business partners. The same report said 175 first-quarter 2026 case reports noted Fusus providing evidence or video footage, compared with 100 in 2025.
The city also launched a Drone as First Responder program in March 2026. WVPE reported that the drone launches from police headquarters after selected 911 calls and is controlled by analysts in the department crime center. WSBT later reported that the drone had been used on about 130 calls in roughly its first month.
Technology may help officers arrive with better information. It can also raise privacy questions. ABC57 reported that South Bend uses 45 Flock cameras, that the cameras helped in 151 cases in 2024, and that civil-liberties concerns remain part of the public conversation.
- More than 500 cameras connected through the city crime center system
- 45 Flock license plate reader cameras
- 89 business camera partners
- 175 first-quarter 2026 case reports where Fusus helped provide video or evidence
- About 130 drone-assisted calls in the first month of the Drone as First Responder program
Those tools can help solve cases and send officers better information. They do not replace witnesses, community trust, good investigations, or prevention work. South Bend will need all of that if the decline is going to last.
Old Rankings Still Follow South Bend Around
South Bend has been called one of the more dangerous cities in the country in older rankings. One example is a Patch article from 2018 that cited a 24/7 Wall St. ranking based on 2016 data.
Older rankings need care. They help explain reputation, not the full current picture. Crime reporting rules, city policing, violence trends, and the national crime environment have all shifted since then. PolitiFact previously noted that South Bend changed how aggravated assaults were counted after FBI guidance in 2016, which complicates some older comparisons.
Still, old reputation does not disappear quickly. People remember the worst years. Residents who lived through gunfire do not forget because a dashboard improved. South Bend has to earn a safer reputation over time, and one violent start to a year can slow that process.
What the Numbers Do and Do Not Say
Crime rates are useful, but they can flatten a city. South Bend has about 103,000 residents, so a relatively small change in incidents can move the rate more sharply than it would in a much larger city. Rates also do not show where crime is concentrated, how residents move through the city, or which neighborhoods feel stable after dark.
The official dashboard gives the freshest look, but it changes as cases develop. Annual crime profiles help with comparison, but they lag behind current city data. News reports capture the human urgency of a violent stretch, but a violent stretch can look larger than the year once the full year is counted.
For South Bend, all three views are needed. The dashboard shows the present. Annual data shows the comparison. Local reporting shows how the numbers feel when they hit families and neighborhoods.
So, Is South Bend Getting Safer or More Dangerous?
South Bend is getting safer compared with the pandemic peak. The drop in criminally assaulted shootings from 133 in 2020 to 62 in 2024 is too large to dismiss. The 2025 gun violence decline adds more weight to that improvement.
South Bend is also still a higher-risk city by Indiana standards. Violent crime and property crime remain above state averages in the annual crime profile. The first quarter of 2026 brought 10 shooting victims and four deaths, which is enough to keep public concern high.
My read is simple: South Bend is improving, but the improvement is not settled. The city has moved away from its worst recent years. It has not moved far enough for residents to stop worrying, especially in neighborhoods where violence and property crime still feel close.
What I Would Tell Someone Visiting or Moving to South Bend
I would not judge South Bend by one crime ranking, one police dashboard, or one scary headline. I would judge it by neighborhood, time of day, transportation, parking, and local context.
For visitors, South Bend is manageable with normal city awareness. Downtown, Notre Dame-adjacent areas, riverfront stops, restaurants, and event spaces bring plenty of ordinary traffic. For people moving in, neighborhood choice matters more than the citywide number.
For residents, the better trend is welcome. For families close to violence, better is not enough. South Bend has made progress, but the city still has work to do before the safer trend becomes the way people actually talk about home.
Summary
South Bend is safer than it was during the worst pandemic-era violence, but it is still not a low-crime city by Indiana standards. The official Part I crime dashboard, updated through April 30, 2026, showed 1,024 Part I crimes under the current filter. First-quarter 2026 shooting victims rose from the unusually low first quarter of 2025, yet stayed below the recent five-year first-quarter average.
The clearest answer is not the most dramatic one. South Bend is moving in a better direction, with serious setbacks still possible. The city is no longer where it was in 2020 or 2022. It is also not far enough from those years for people to stop paying attention.