
South Bend is a mid-sized Midwestern city with a long history of crime concerns. Public perception has often labeled it as unsafe, supported by past statistics and political rhetoric.
Key question remains: is South Bend becoming safer, or does it still rank among dangerous cities? Evidence suggests a mixed reality.
Data indicates high crime levels and troubling rankings, whereas more recent figures indicate noticeable improvement.
Let’s see what the numbers are saying.
South Bend Has Been Considered Dangerous
| Category | Violent | Property | Total |
|---|---|---|---|
| Number of Crimes | 1,000 | 2,197 | 3,197 |
| Crime Rate (per 1,000 residents) | 9.64 | 21.18 | 30.83 |
According to NeighborhoodScout, South Bend has a crime rate of 30.83 per 1,000 citizens, a bit lower than in Gary, with 1 in 104 having a chance of becoming a victim of a violent crime. It should be noted that the above-average crime rate has persisted over the past couple of decades.
Crime data has placed South Bend far above state and national averages for years.
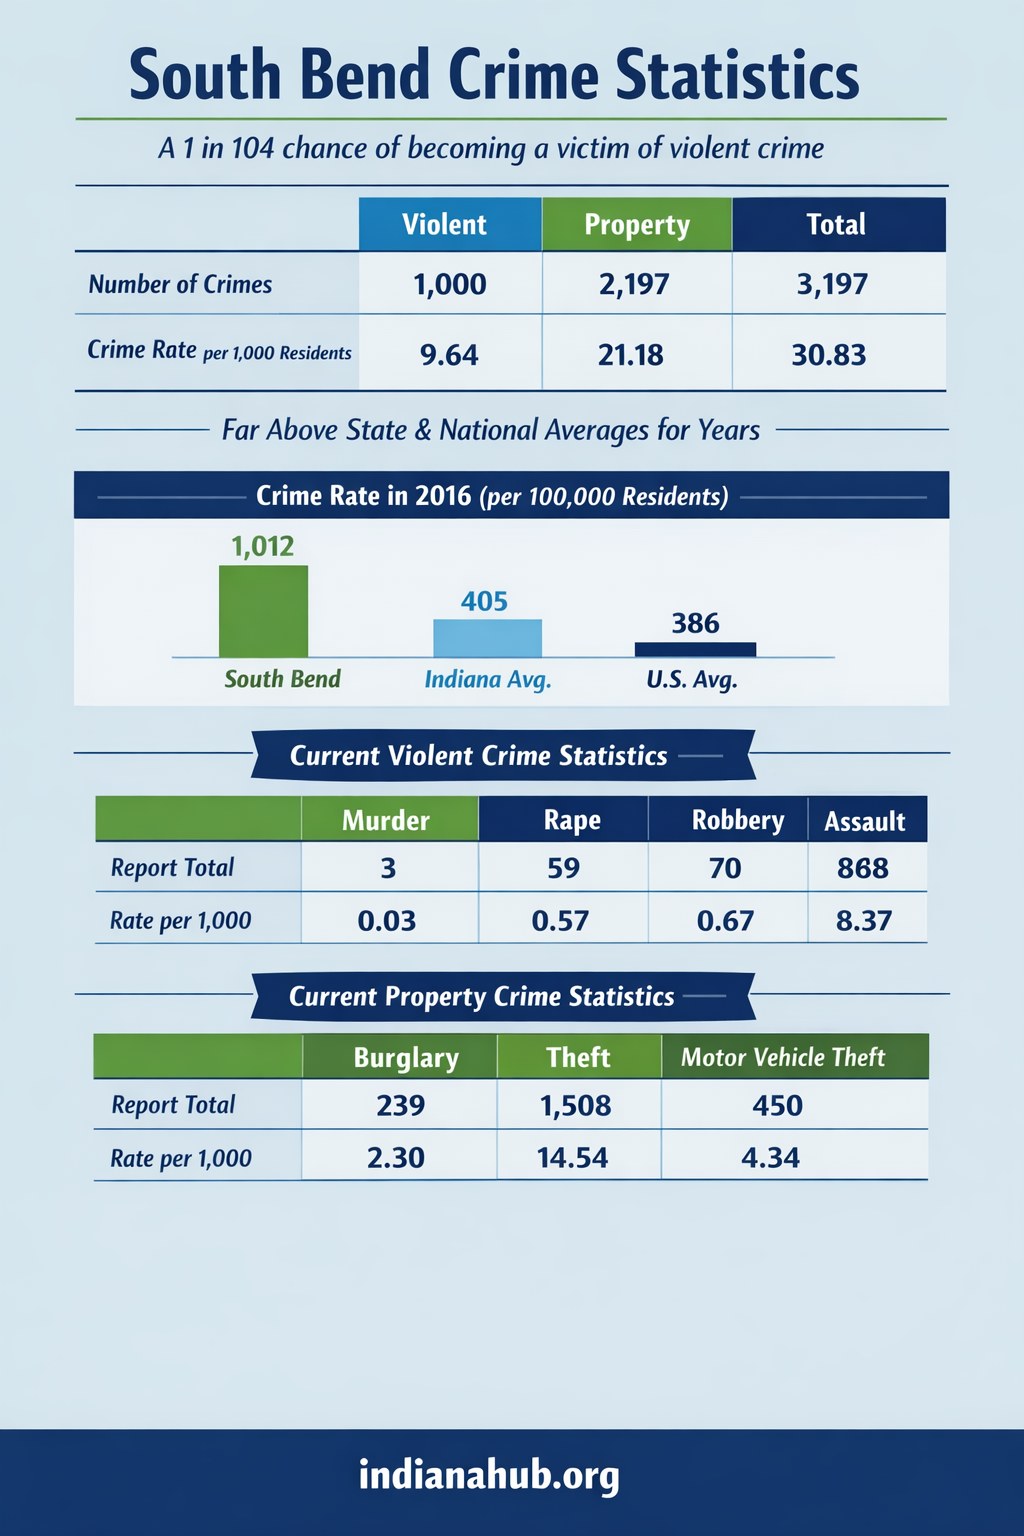
- Violent crime rate in 2016: 1,012 per 100,000 residents
- Indiana average: 405
- U.S. average: 386
These numbers indicate more than twice the state and national levels at that time, as reported in the NeighborhoodScout report above. Recent figures continue to show elevated crime despite improvement. For instance:
South Bend has a violent crime rate of 9.64, while the state level is 3.13, and those numbers are distributed like this:
| Category | Murder | Rape | Robbery | Assault |
|---|---|---|---|---|
| Report Total | 3 | 59 | 70 | 868 |
| Rate per 1,000 | 0.03 | 0.57 | 0.67 | 8.37 |
In terms of property crime, the local rate is 21.18 while the state level is 13.79, and it looks like this when the numbers show us the categories of property crime:
| Category | Burglary | Theft | Motor Vehicle Theft |
|---|---|---|---|
| Report Total | 239 | 1,508 | 450 |
| Rate per 1,000 | 2.30 | 14.54 | 4.34 |
So you can see that despite the progress, crime rate figures keep South Bend in a higher-risk category compared with many cities nationwide.
@hoodmaps Places to Avoid when Visiting South Bend Indiana #southbend #southbendindiana #indiana #placestovisit #fyp ♬ original sound – Aura
Long-term crime issues
Patterns of violence have remained a concern over an extended period. Assaults, shootings, and other violent incidents have occurred consistently, shaping public perception. A major surge around 2019 and 2020 raised alarm across the community.
Not only that, we can see that the recent increase in violent crime in January 2026, which resulted in three fatal shootings, after several years of improvement, has once again sparked worry among locals.
Public officials and critics have repeatedly pointed to these trends as evidence of a long-standing problem rather than a short-term issue. For instance, we can see that the local community members plead for some kind of measures that would knock down those rates.
Public perception has been shaped not only by data but also by messaging. Political narratives have often reinforced a negative image of South Bend. Some sources describe it as one of the most dangerous cities in the country, focusing heavily on violent incidents.
- Coverage often includes shootings involving bystanders
- Incidents involving minors receive significant attention
Criticism of city leadership is often tied directly to crime conditions, suggesting that governance plays a role in public safety outcomes.
Evidence That South Bend Is Getting Safer
Recent data shows measurable improvement across multiple categories. Early 2025 figures indicate a strong decline in crime compared to previous years.
- Crime down in nearly every major category during early 2025
- Shooting victims decreased by 50 percent
- 0 murders reported
- 0 fatal shootings
- 0 open murder cases
Some would say that the recent spark we’ve mentioned above is direct proof of the opposite, but if you take a look at the numbers from previous years, you will see that the situation is better, generally speaking.
Long-term decline since pandemic peak
Violence has decreased significantly since its peak around 2020, with 133 fatal shootings occurring that year. That period marked one of the highest levels of violent crime in recent history.
- Shootings with injuries have been reduced by more than 50 percent since the peak
- Fatal shootings dropped from 26 to about 5 in a recent year
These reductions indicate sustained progress rather than a short-term fluctuation.
Reasons for the High Crime Rate in South Bend
Several structural and social factors help explain why South Bend has experienced higher crime levels than national averages. Data shows that crime is not random but tied to economic conditions, neighborhood inequality, and patterns of property crime.
Economic challenges and poverty
Economic conditions play a major role in crime levels. South Bend has a significantly higher poverty rate than the national average, which increases the risk of both violent and property crime.
- Poverty rate in South Bend, Indiana, is around 20.8% of residents.
- U.S. average poverty rate is around 12.5%
Lower income levels also affect stability across neighborhoods. Median household income remains relatively modest, and economic pressure can contribute to higher crime rates.
Unemployment adds another layer of risk. Local data shows fluctuations in job availability, with some periods reaching higher unemployment than the national average.
Crime is not evenly distributed across South Bend. Some neighborhoods experience much higher levels of crime than others, which increases overall city averages.
- Lower-income areas show significantly higher crime grades
- Higher-income neighborhoods often receive A or A+ safety ratings
- Some areas fall into C or lower categories with elevated risk
Income differences between neighborhoods are also clear. Some high-crime areas report median incomes under $30,000, while safer areas exceed $80,000.
Such concentration means that a smaller number of neighborhoods account for a large share of incidents.
High rates of property crime

Property crime makes up a large portion of total crime in South Bend. Theft, burglary, and vehicle-related crimes occur frequently and raise overall crime levels.
- Property crime affects about 1 in 47 residents
- Car theft rates rank among the highest in the nation
- Larceny and theft exceed national averages by more than 20%
These offenses occur more often than violent crimes and strongly influence the city’s overall crime index.
When it comes down to the vehicles stolen in Indiana, the most common vehicles stolen in 2024 in the state of Indiana are:
| Rank | Make/Model | No. of Thefts |
|---|---|---|
| 1 | Hyundai Elantra | 475 |
| 2 | Hyundai Sonata | 446 |
| 3 | Chevrolet Malibu | 319 |
| 4 | Kia Optima | 302 |
| 5 | Dodge Charger | 288 |
| 6 | Ford F150 Series | 256 |
| 7 | Kia Soul | 254 |
| 8 | Chevrolet Silverado 1500 | 204 |
| 9 | Toyota Cheverolet Impala | 193 |
| 10 | Ford Econoline E450 | 188 |
Can Crime Statistics Be Misleading?
Crime rankings often rely on rates per 100,000 residents, which can distort perception. Smaller cities like South Bend, with a population of around 103,000, may appear more dangerous than larger ones even when total crime counts are lower.
- Smaller population leads to higher per capita rates with fewer total incidents
- Larger cities may report more total crimes but lower rates per resident
Such methods can make South Bend seem more dangerous than cities with higher overall crime numbers.
Crime is also not evenly distributed across the city. Some neighborhoods experience higher levels of violence, while others remain relatively stable. Broad comparisons fail to capture these differences.
Media coverage and political messaging can further shape perception. Focus often falls on extreme or dramatic cases, which can influence how the public views safety.
Such patterns can create fear-based narratives that do not fully align with broader trends.
Summary
South Bend has a documented history of high crime, supported by past statistics and public perception.
Recent data shows measurable progress, including major reductions in shootings and homicides, despite the spikes that occur from time to time, like in January 2026.
Political and media narratives can shape perception in ways that do not fully match current trends. South Bend is becoming safer, yet significant public safety challenges remain, with crime levels still above national averages.
Sources
- NeighborhoodScout – South Bend, Indiana
- Patch – South Bend One Of The ‘Worst Cities To Live In,’ Study Finds
- WNDU – South Bend violent crime increases in January
- South Bend Tribune – Community members plead for guns to be put down
- WSBT – South Bend Police say 2025 crime numbers are down in quarterly stats meeting
- ABC57 – Gun violence down in South Bend, crime data shows
- Census – South Bend city, Indiana
- Library Esri – Crime and neighborhood charateristics in South Bend, Indiana
- My Wabash Valley – Which vehicles are stolen most often in Indiana?
- SBR Chamber – South Bend Region